Working with palladio

Palladio is a network visualization tool created at Stanford University. It allows users to to see connections in large data sets that would otherwise be difficult to discern by just reading the data the old fashioned way.

In using Palladio to create a network analysis of the WPA slave narratives from Alabama, it allowed me to define the information to be analyzed. For example, one could choose as a “source” the name of the interviewer and the “target” the name of the interviewee. The resulting graph shows the networks of interviewers and interviewees.

However, the networks are not equally revealing or useful, at least in my initial explorations of the tool. Showing the relationships between interview location and location of where the subjects were enslaved was less revealing than using the kepler mapping tool. Of course, Palladio is a network analysis tool and not a geographic mapping tool. The information provided included GPS locations and names of towns or counties. It was difficult to get any sort of spatial visualization based off this particular graph. Other relationships were too “busy” to make sense of, at least at my first attempt. So many lines were crossing between topics of interviews and names of subjects that one couldn’t really follow. Maybe with more practice, the networks will be more revealing to me. The creators were also well aware and quite upfront with the limitations of the tool.

As the creators of Palladio said, this tool is not an end in itself. It is yet another tool to help scholars take a wide view look at data in order to help develop further research questions and topics of study that may not otherwise reveal themselves. In comparing visualizations of the relationships between different sources and targets, I was able to form not just initial impressions of the interviews, but also questions which would require a deep reading of the documents again. I am particularly interested in how the interviewers found and chose their subjects. House slaves seemed to dominate the subjects, but one would think that field slaves were more numerous. So how do house slaves become such a large population of subjects? Was it based on how the interviewers found their subjects? Was it based on the willingness of subjects to be interviewed? Likewise, I saw that several female interviewers interviewed only female subjects. Was this by choice of the interviewer? Based on what? Or was it by choice of the subject? Also based on what? Or is there no real connection there at all?

Network analysis through Palladio is a powerful tool to revisit what we think we already know and see if currently accepted relationships hold up. It also can help reveal patterns and relationships we never even thought about.
Mapping with kepler.gl

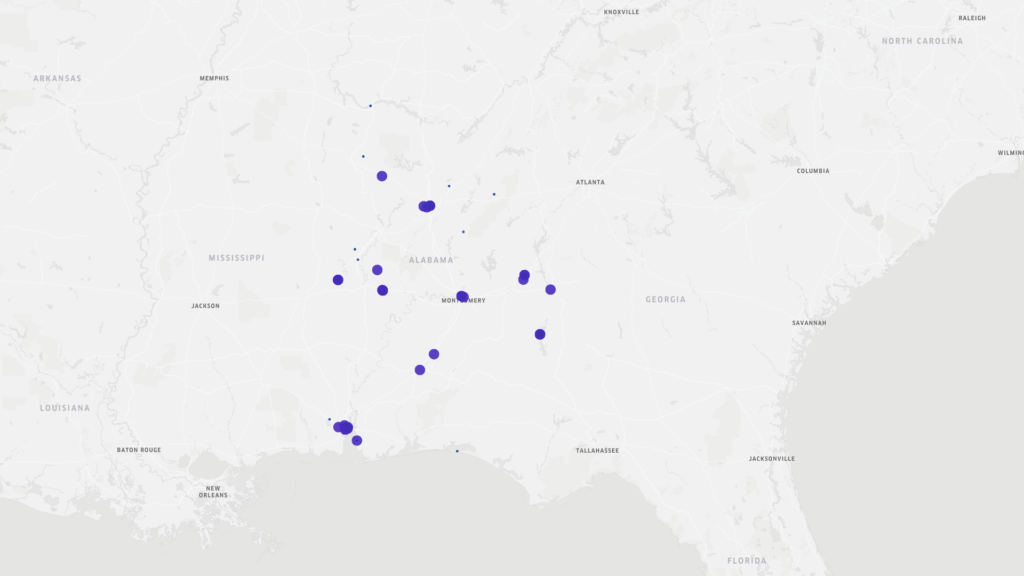
Learning about mapping data was a most enlightening experience, and one I was looking forward to the most. I do love a good map. I was therefore surprised by the fact that my initial conclusions, based solely on a point map were, well, wrong, as was soon revealed by other maps. The original point map showing the locations and basic data regarding the New Deal era slave narratives from Alabama led me to conclusions that the major metropolitan areas of Alabama (Montgomery, Birmingham, and Mobile) were where the most interviews took place.

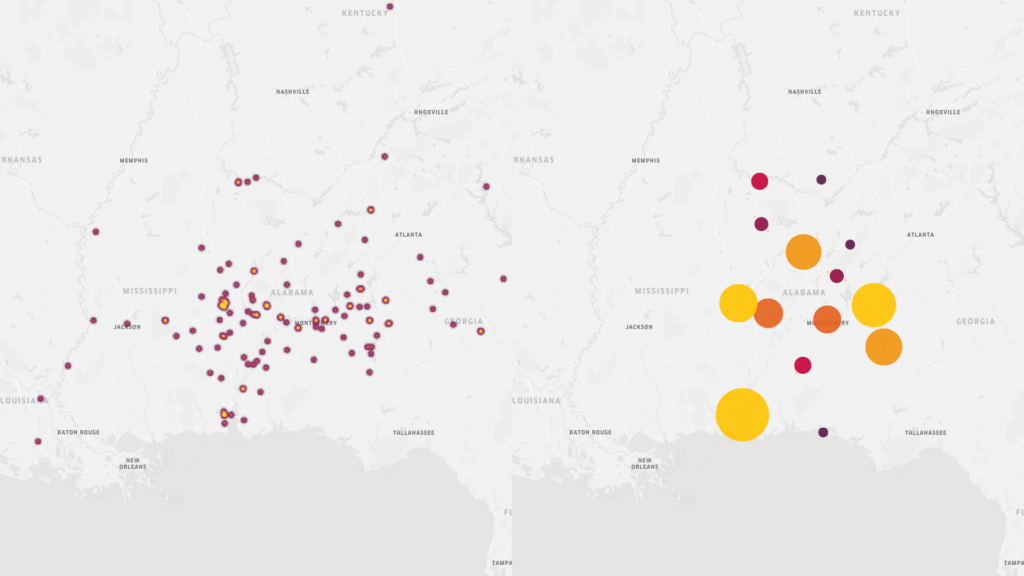
This was true to an extent. However, when moving to maps that show concentrations of interviews in other manners (heat and cluster maps) Mobile still stands out as a key area of concentration, however, we also see other areas outside of Birmingham and especially Montgomery that show greater interview activity.

Kepler maps
Heat and cluster maps of WPA slave narrative interviews in Alabama

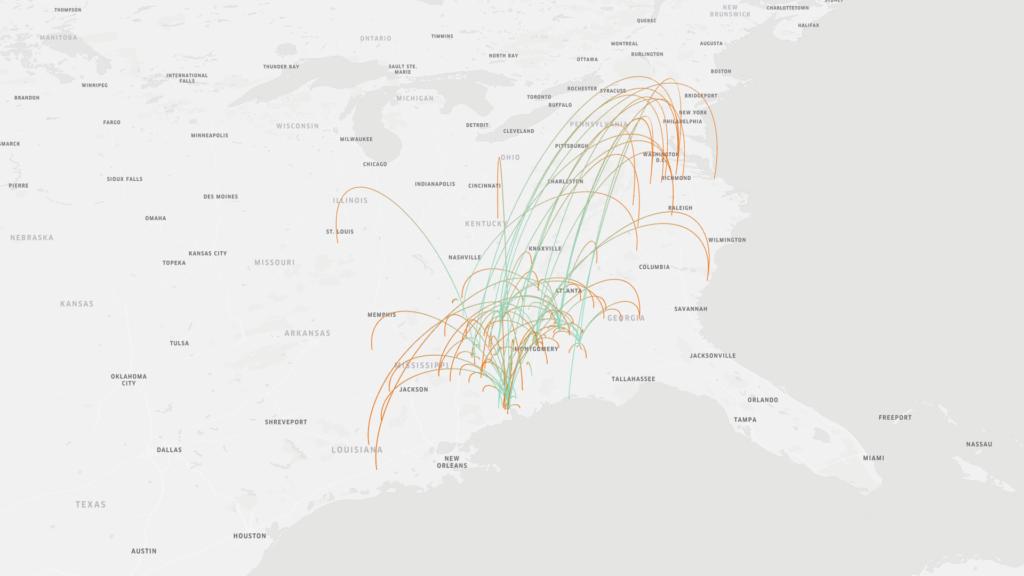
The original map above also provided information regarding the place of birth of the interviewees. Just a brief visual scan of this information led me to believe that most of the interviewees were born near where they were interviewed. However, an arc map that showed the place of birth v. the place of interview gave a different picture. There was much greater mobility of formerly enslaved people than first believed. Trying to read the information on the original map was difficult as the points overlapped. Furthermore, reading the information still wouldn’t give as clear of a story as the map does.

Map indicating place of birth of interviewees (as shown by the green end of the arc) v the location in which the interview took place (as shown by the orange end of the arc)

The Kepler mapping tool is helpful in making sense of spatial data in a “big data” collection such as the New Deal slave narratives. However, it is a learning curve. Understanding how to input parameters was relatively easy when given explicit instructions (thank you), but when I went back and tried to recreate the maps and create new ones, I was a bit confused. Like with so much it will take time. However, reading these various maps brought up questions that I would not have considered if I was just reading the text of the interviews, particularly about movements of people after emancipation.

Biggest lesson learned: never finish with first readings. Rearrange the material. Ask other questions, See how the results differ.

Guide to digitization

Digitizing items requires much more consideration than merely taking a photo and uploading it to your site. How does one capture the essence of the item in a virtual environment? When creating an archive, one must consider how to convey as much information as possible for any item: size, use, material, color, sound, and, yes, smell. Also, one must consider the readability of text images. For non-text images, it seems that video provides greater information than a still image. One can compare sizes of similar items or at least add scale, although that can be done with a still image the scale item can be temporarily added then removed from a video thus keeping the focus on the main item. Videos help to provide sound; one could go so far as to narrate the item, but metal lids do provide a sound that indicates material and a bit of information on weight. One can get a better sense of the image as a whole in video. Are there marks on the bottom of some items indicating where and when something was created? Is the appearance of the item uniform throughout? It is easier to see this on video, although multiple photographs could be utilized as well. The big question regarding use of video would be the size of the file. If uploading many videos, would that be burdensome for the site or for the user.

Digitizing photographs, while seemingly straightforward, just scan photo and upload, also requires much more consideration, especially given the software that is now available to edit and enhance photographs. Do you upload the photo as it is in its current condition? Do you upload the photo after “repairing” wear and tear and other “defects” of time? Does color correction or changing the contrast to make certain elements more visible change the meaning of the photograph? Does it then become a different artifact?

While clearly digitization of historical sources has increased the opportunities for scholarship by making sources in far away places available to researchers who could otherwise not access them, the scholar now has a new set of questions to ask of the sources on his or her screen. Questions not just of scholarly significance but of accuracy of representation and even of the contextualization of the content collections.