Staring this program, I was not particularly interested in conducting oral histories. I have been studying people who have been long dead for over two decades now. Oral history seemed unnecessary. However, as I discuss my work with colleagues at Le Moyne and potential partners in the “Syracuse at the Crossroads” digital history project idea, oral history keeps coming up. People want to conduct oral history interviews and learn from these new sources. So oral history it is.
Using the Oral History Metadata Synchronizer application (OHMS) I experimented in indexing with the interview segment of James Arnold recounting his WWII experience when his ship landed in Japan soon after the dropping of the nuclear bombs. The real gem in the interview isn’t about that military experience but about Arnold going off to look for a kimono and ending up befriending a young man who takes Arnold to his house where his wife and young baby were. The group grew with the addition of some neighbors and they ended up eating together, singing songs and doing their best to communicate. This gem of a story ended with Arnold telling some Marines who were upset by his “fraternization with the enemy” that “the war is over. Get over it.”
Figuring out where to start new sections didn’t seem that difficult. The topic changes were fairly clear. However, it all became more challenging when trying to choose subjects and key words that would be relevant to the interview and meaningful to the listener. This will take practice. I tried to embed GPS coordinates for Hiroshima, but I am not sure if it worked. Once one gets the hang of the how to deal with the actual technology, the real challenge will be in creating the metadata to make the indexing as useful as it is economical. I will definitely be spending more time with OHMS; I must do what I can to give the people what they want!
I am slow, but I get there eventually. After leaving my first career, I started my PhD work in 1997, which is the same year Jose Antonio Brandao published his book, “Your fyre shall burn no more” Iroquois Policy Toward New France and its Native Allies to 1701. Brandao challenged the interpretation of the Beaver Wars, where Haudenosaunee supposedly engaged in warfare with other nations to dominate the beaver fur trade with New France. In doing so, he utilized the Jesuit Relations by counting the numbers of pelts recorded as captured in Haudenosaunee raids on other nations. Most of the book was made up of appendices showing his evidence. “No!” I exclaimed! “How can one overturn major historical interpretation by using sources in such a way?” I’m slow, but I get there. Yes, you can use sources in wild and crazy ways.
I have recently moved into the world of environmental history, with a particular interest in upstate NY, where I am located, and the Great Lakes. This project is the very slow start of thinking of how to use travel narratives to map environmental change over time.
I looked at four sources in particular, but really succeeded in mapping just one so far. These sources were found in the Early Encounters in North America database, published by Alexander Street. The idea was to first look at the word cloud produced by Voyant to get an understanding of what the author’s were focusing on. Then using Kepler I would chart the location of non-human animals, plants, and soil conditions as observed in the narratives. I am going slow, but I am getting there.
Journals of the Reverend Peter Jacobs 1852
As you can see from the above Voyant word cloud, Jacobs’s focus was not on the natural word so much as the spiritual. He’s there to convert Indians, but the fact that he is also travelling to Hudson Bay Co forts, economics is on his mind. His view of the natural world, like most Europeans had to do with how the natural world could be converted to commodities, which does go hand in hand with converting Indians to Christianity. He’s looking for God and gold, but we can also map out the presence of fish, plants, trees, copper, etc from his work. See below for that.
Flint’s letters from America 1818
Flint was less concerned about souls, and most of his observations were more about the cities he encountered than the natural world. This was more of an experience of spending much time reading with less to show in the end.
Observations on the inhabitants, climate, soil, rivers, productions, animals, and other matters worthy of notice, made by Mr. John Bartram, in his travels from Pensilvania to Onondago, Oswego, and the lake Ontario, in Canada, to which is annex’d, a curious account of the cataracts at Niagara, by Mr. Peter Kalm, a Swedish gentleman who travelled there. 1751
John Bartram was a naturalist who travelled extensively through the American colonies. As you can see from the word cloud, while he makes observation on many aspects of the region of what are now PA and NY, it’s water that steals the show. Rivers, lakes, creeks, are at the center of his travels and records.
Jesuit Relations and Allied Documents, vol 43, Chapter IV: Journey of the Fathers of our Society, and some Frenchmen, to the Country of the Upper Iroquois called Onnontoeronnons. 1653
Like Jacobs, the Jesuits were looking for souls, oh, and some gold too. I work at a Jesuit college. The Jesuits continue to celebrate their 17th century work among the Onondaga Nation of the Haudenosaunee. The Onondagas do not share that point of view. They see the Jesuits arrival more as a search for commodities and the first steps to eradication of the Onondaga people. So that is a different issue, but one that is always on my mind. I am not dealing with that question here, but I throw it out if anyone has ideas on how to approach it. Remember, I’m slow, but I get there.
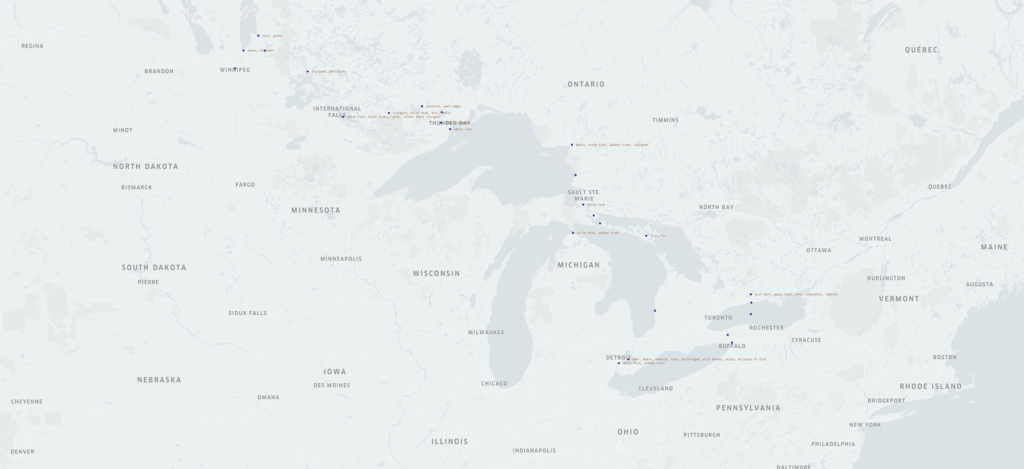
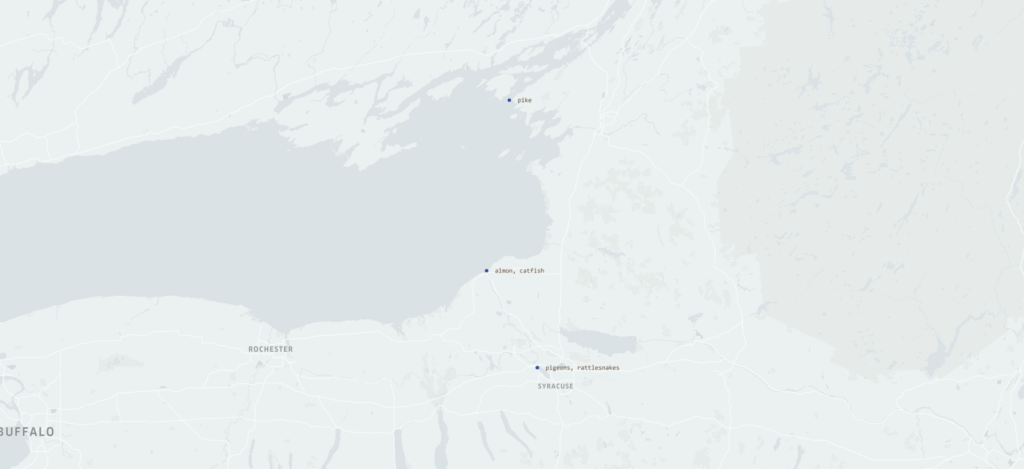
Okay, so what about the mapping! The word clouds show us a different story from the one I am trying to uncover. I must say, mapping Jacobs’s narrative is where I had the most success (except for apparently drowning the city of Toronto in the middle of Lake Ontario).
The map above shows the locations of his travels and the animals he recorded seeing. This is particularly useful in tracking the timing and extent of impact of invasive species on native species in the Great Lakes, particularly the four above Niagara Falls. The Falls served as a barrier for invasive species, but the Erie Canal offered one entry point for invasive species above the falls, then the creation of the Welland Canal, which could take some ships up and around the falls offered another. Both were opened at the time Jacobs took this journey. At this point, native species of trout, whitefish, and sturgeon remain numerous.
After going through Flint’s narrative, I decided, at least for the moment, it was not worth mapping as his observations dealt mostly with increased manufacturing in cities through which he traveled. This could make a possibly interesting project, but it doesn’t fit the needs of this experiment. I slowly move on.
JR vol 43 Chapter IV
You cannot study Indigenous history in Iroquoia without dealing with the Jesuit Relations. There are problems, many problems. So a new problem exposed itself to me as I wanted to create maps. That problem is the use of place names. There was no standard spelling in the 17th century, plus, I am dealing with a translation, plus names have changed. Many times, there was no name used, you just had to figure it out “the river that feeds Gannentaa” is the Oswego River. Gannentaa is now called Onondaga Lake. That was the easy part. I believe these sources are going to be key in creating a larger environmental understanding of this region, but it is going to take time. Luckily, I’m used to going slow.
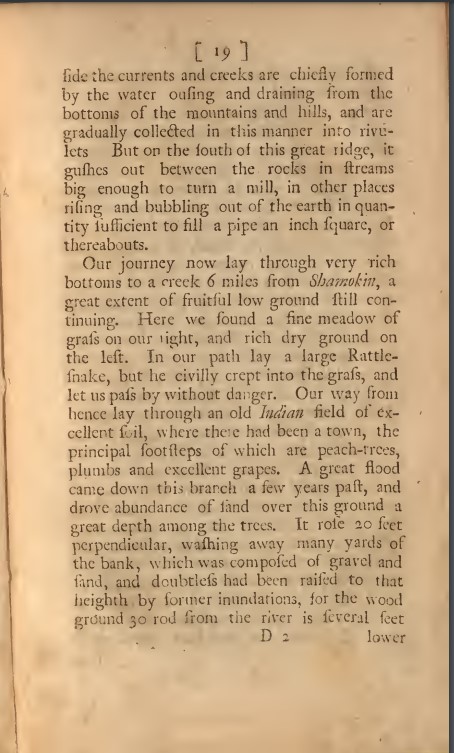
I can say the same thing for Bartram’s journal. He travels by land and water, and it can be quite difficult to figure out exactly where he is.
First, the modern city of Shamokin, PA is not where the original Indian village of Shamokin was located. The Shamokin to which Bartram refers, is actually Sunbury, PA. Mostly he is traveling up the east branch of the Susquehannah River, but where he is along the river is difficult to say. I thought I had him tracked, but then he was suddenly in Onondaga, and if he followed the path I thought, well, he would have had to fly to get to Onondaga so quickly. This will take some time and thought about how best to use such sources and the questions I want to ask of them. A slow process, but I will get there.
For the past few weeks I had the opportunity to explore the WPA slave narratives with the use of Voyant, Kepler, and Palladio digital tools. Each tool provided new insights on using the slave narrative data set, and as I continue to consider the experiences, I see how the threw different tools can compliment each other in helping a researcher come up with research questions and strategies.
For American historians, the WPA slave narratives, and their many problems, are well known. Dealing with issues of age of subjects, loss of memory, lack of trust for the interviewer, no consistent questions or transcription methods, and lack of consistent collection policies have all made the slave narratives a problematic source. Despite these problems, historians continue to go back to them as they are the rare example of the voice, even through layers of administrative changes, of large numbers of people who experienced slavery. The tools under discussion here allow us to view the sources from a distance and look at them in a new light.
Voyant is a tool that allows for textual analysis, particularly text mining. By inputting the documents into Voyant helped to uncover topics of discussion across interviewers and states. The creation of Cirrus word clouds highlighted the words that appeared most often in the interviews and allowed a “big picture” view of the data set that would not be possible reading through the documents. Not only did Voyant help to identify the main words/topics, by looking at a state by state analysis of particular words, one could find outlier words; words that were only used in a few states. This particularly happened when some interviewers wrote the answers in dialect while others used standard spelling. So “master” showed up as “massa” and “marster” as well as “master.” While this reveals methodological problems in the interviews, it does help in creating a strategy in identifying topics across the dataset.
The tools provided in Palladio provided a bit more ability to look at words and topic within the dataset, but with the extra bonus of being able to identify the formerly enslaved person who spoke about these topics as well as the interviewer. By being able to pinpoint this relationship, a researcher can look for other patterns such as do particular interviewers seem to focus on specific topics? Are certain topics discussed primarily with those who served as house or field slaves? Men or women? Palladio’s networking capabilities revealed much about relationships between interviewer and subject.
Palladio is a “mapping” tool, but it is one that focuses on network analysis more so than geographic mapping. So while it was quite helpful in understanding some relationships, when trying to find actual geographic relationships in the data, such as where the subjects were born v. where they were interviewed,” kepler was much more revealing than Palladio. Kepler allowed us to take a big picture view of how people moved, or not, across the country between emancipation and the Great Depression.
Each tool was quite revealing, and I believe putting them together to ask questions regarding the source is even more useful. Researchers could ask more questions regarding geography, such as do we see patterns in subjects who were born in a particular region but were interviewed elsewhere. This could be particularly interesting for those subjects who were interviewed in antebellum “free soil” states. I wondered more about gendered relations between interviewer and subject. Can we see particular topics being discussed when women interview women and men interview men? What about when men interview women? Can this reveal patterns of subjects telling the interviewers what they want to hear? Does geography play a part in this?
While these tools are quite revealing on their own, it is also important to keep in mind that they are tools, not the end product of research. They do not replace the hard work of archival work and reading the actual documents, but they help in formulating questions and further research strategies, and to shine new light on otherwise well known documents.
Palladio is a network visualization tool created at Stanford University. It allows users to to see connections in large data sets that would otherwise be difficult to discern by just reading the data the old fashioned way.
In using Palladio to create a network analysis of the WPA slave narratives from Alabama, it allowed me to define the information to be analyzed. For example, one could choose as a “source” the name of the interviewer and the “target” the name of the interviewee. The resulting graph shows the networks of interviewers and interviewees.
However, the networks are not equally revealing or useful, at least in my initial explorations of the tool. Showing the relationships between interview location and location of where the subjects were enslaved was less revealing than using the kepler mapping tool. Of course, Palladio is a network analysis tool and not a geographic mapping tool. The information provided included GPS locations and names of towns or counties. It was difficult to get any sort of spatial visualization based off this particular graph. Other relationships were too “busy” to make sense of, at least at my first attempt. So many lines were crossing between topics of interviews and names of subjects that one couldn’t really follow. Maybe with more practice, the networks will be more revealing to me. The creators were also well aware and quite upfront with the limitations of the tool.
As the creators of Palladio said, this tool is not an end in itself. It is yet another tool to help scholars take a wide view look at data in order to help develop further research questions and topics of study that may not otherwise reveal themselves. In comparing visualizations of the relationships between different sources and targets, I was able to form not just initial impressions of the interviews, but also questions which would require a deep reading of the documents again. I am particularly interested in how the interviewers found and chose their subjects. House slaves seemed to dominate the subjects, but one would think that field slaves were more numerous. So how do house slaves become such a large population of subjects? Was it based on how the interviewers found their subjects? Was it based on the willingness of subjects to be interviewed? Likewise, I saw that several female interviewers interviewed only female subjects. Was this by choice of the interviewer? Based on what? Or was it by choice of the subject? Also based on what? Or is there no real connection there at all?
Network analysis through Palladio is a powerful tool to revisit what we think we already know and see if currently accepted relationships hold up. It also can help reveal patterns and relationships we never even thought about.
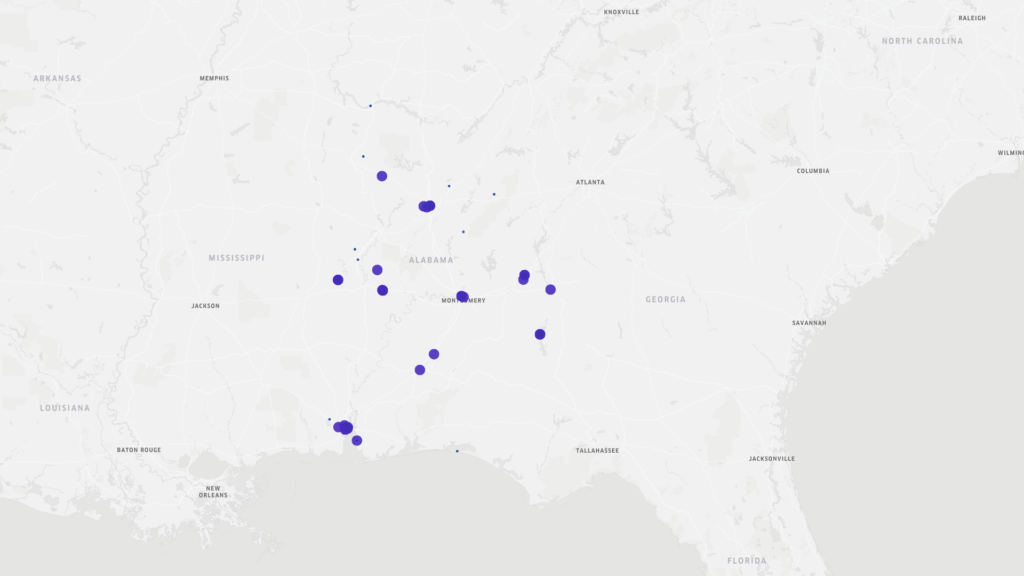
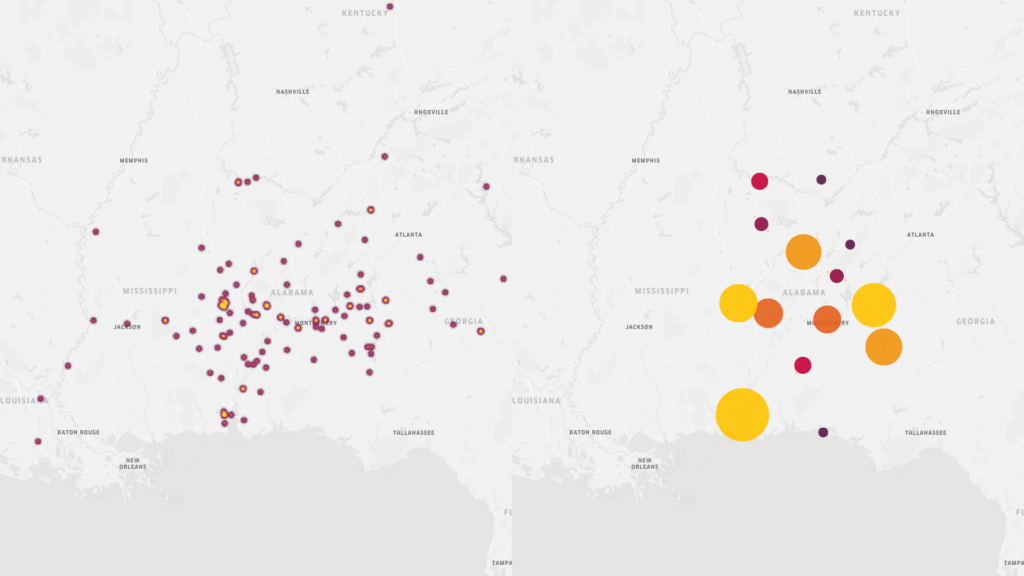
Learning about mapping data was a most enlightening experience, and one I was looking forward to the most. I do love a good map. I was therefore surprised by the fact that my initial conclusions, based solely on a point map were, well, wrong, as was soon revealed by other maps. The original point map showing the locations and basic data regarding the New Deal era slave narratives from Alabama led me to conclusions that the major metropolitan areas of Alabama (Montgomery, Birmingham, and Mobile) were where the most interviews took place.
This was true to an extent. However, when moving to maps that show concentrations of interviews in other manners (heat and cluster maps) Mobile still stands out as a key area of concentration, however, we also see other areas outside of Birmingham and especially Montgomery that show greater interview activity.
Heat and cluster maps of WPA slave narrative interviews in Alabama
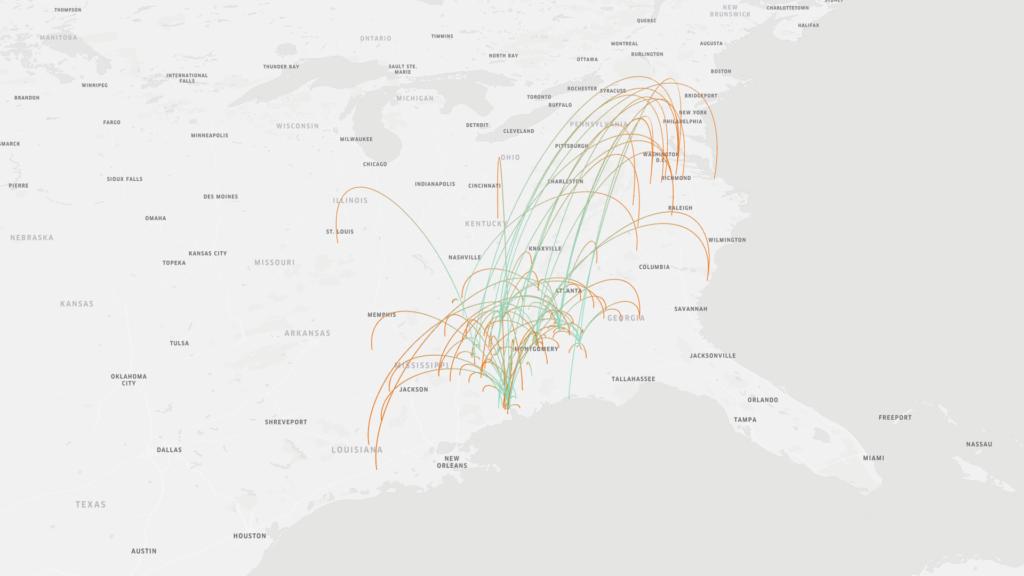
The original map above also provided information regarding the place of birth of the interviewees. Just a brief visual scan of this information led me to believe that most of the interviewees were born near where they were interviewed. However, an arc map that showed the place of birth v. the place of interview gave a different picture. There was much greater mobility of formerly enslaved people than first believed. Trying to read the information on the original map was difficult as the points overlapped. Furthermore, reading the information still wouldn’t give as clear of a story as the map does.
Map indicating place of birth of interviewees (as shown by the green end of the arc) v the location in which the interview took place (as shown by the orange end of the arc)
The Kepler mapping tool is helpful in making sense of spatial data in a “big data” collection such as the New Deal slave narratives. However, it is a learning curve. Understanding how to input parameters was relatively easy when given explicit instructions (thank you), but when I went back and tried to recreate the maps and create new ones, I was a bit confused. Like with so much it will take time. However, reading these various maps brought up questions that I would not have considered if I was just reading the text of the interviews, particularly about movements of people after emancipation.
Biggest lesson learned: never finish with first readings. Rearrange the material. Ask other questions, See how the results differ.