I love maps. I’ve always loved maps. Of course, they are useful in getting us places, but I really love what they tell us about how their creators understood what was important about a particular place. They are crucial to understanding how people, countries, cultures understood and claimed territory and relationships among people and places. I love how they spark imagination for travel and telling stories.
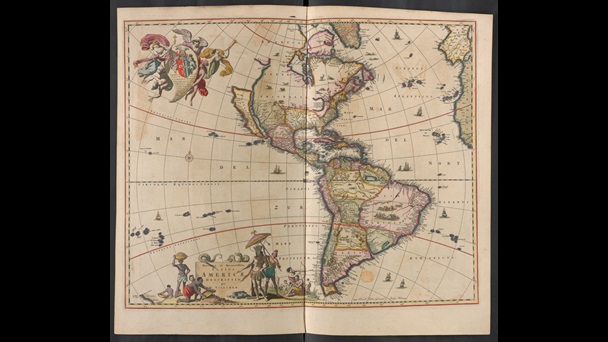
The above map is from a collection of maps of North and South America from around 1687 and is currently held in the British Library. European maps in the so-called “Age of Discovery” were used, not as a travelling guide, but as a way of claiming territory. Areas that were unknown were often filled in with drawings that typically illustrated European domination of non-European populations.
For years now, I have been fascinated at how historians have used mapping technology to tell new stories with “old” data, and how they can also utilize this technology to enable others to create their own maps using data that has been provided for them. Seeing the work of others made me think, wow, I really want to learn to do that. But how, and where do I start?
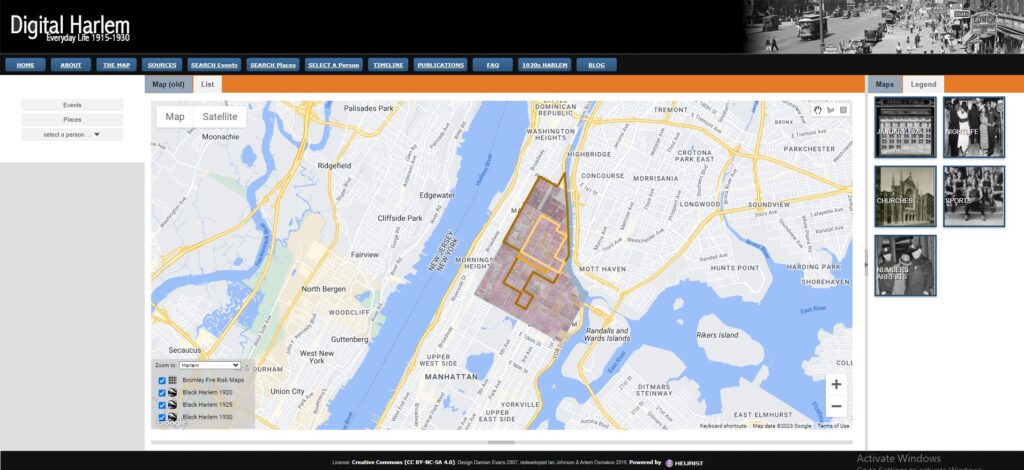
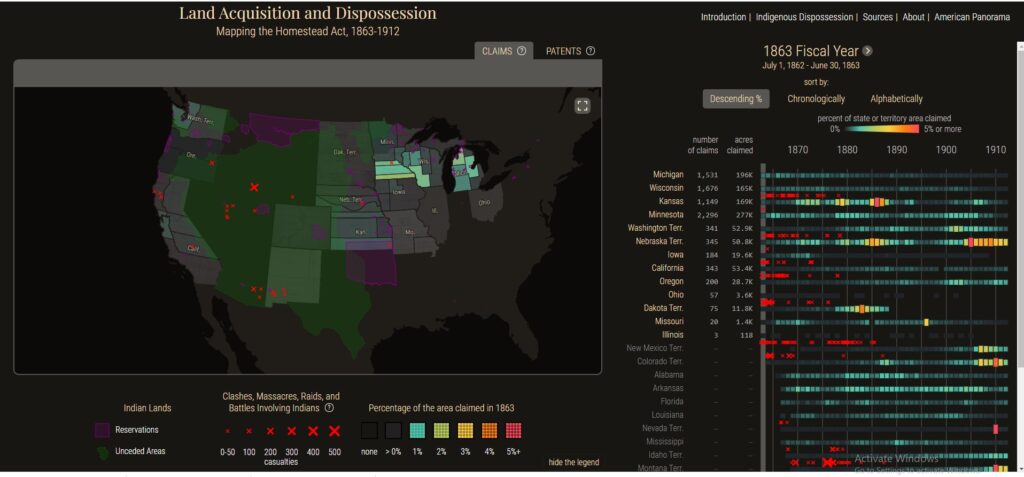
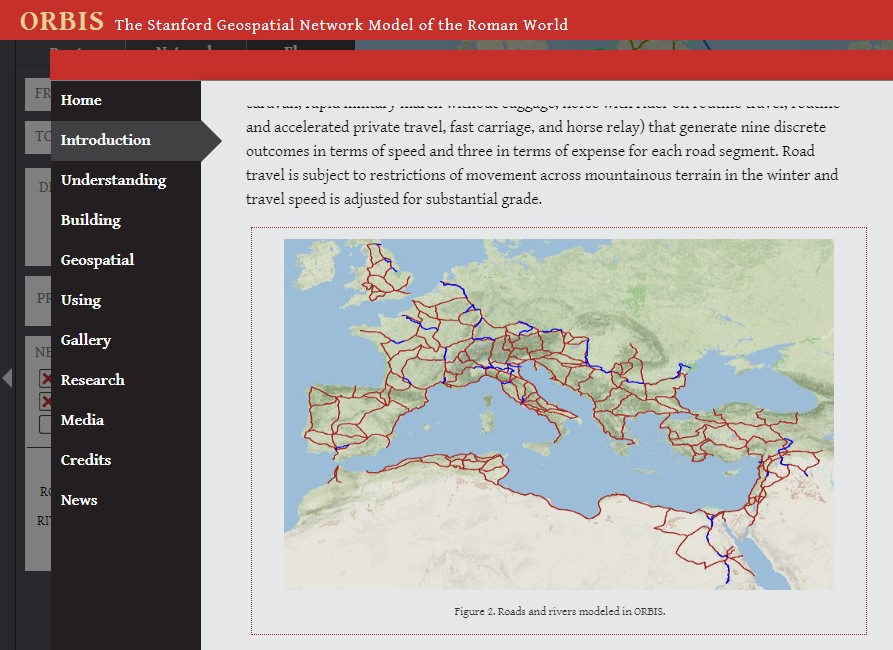
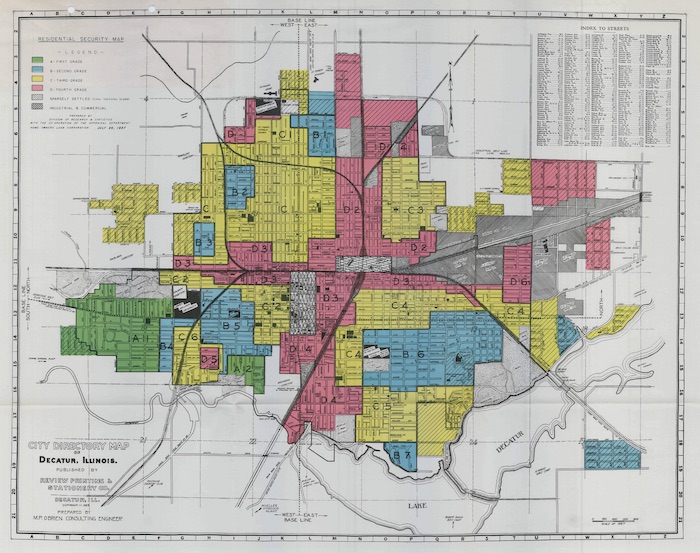
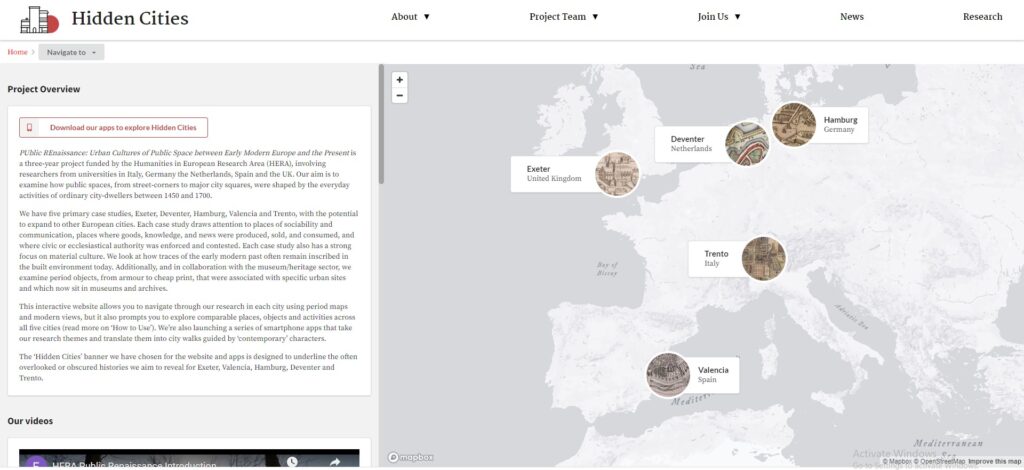
Above are screen shots from some of my favorite mapping projects. Top row left to right are Digital Harlem, Land Acquisition and Dispossession: Mapping the Homestead Act, 1863-1912, Orbis: The Stanford Geospatial Network Model of the Roman World. The second line is Mapping Inequality: Redlining in New Deal America, and finally the Hidden Cities project. Definitely check them out.
Luckily, I found myself in a position to participate in the George Mason University Graduate Certificate program in Digital Public Humanities, which allowed me to happily stumble my way to the Mapping Violence in Early Modern Italy project under the direction of Dr. Amanda Madden. Finally, I had a starting point and an extremely knowledgeable and patient guide, which was crucial because I knew very little about mapping technology or early modern Italian history.
No, not everyone has the ability to undertake a graduate certificate program in order to gain experience in digital mapping. Therefore, I offer my own experience with Mapping Violence in Early Modern Italy as a guide to starting on the path of digital mapping for history.
I will mention technology first, because that was where I was expecting to start when I began my work with Dr. Madden. However, I quickly learned that before you even get to the technology of Geographic Imaging Systems (GIS) there are other issues to consider and planning to be done. First and foremost, creating a digital mapping history project is a form of historical inquiry, and that is where to begin. So, as Julie Andrews sang, and I love to quote, let’s start at the very beginning; it’s a very good place to start.
As with any history project you start with your topic and, more specifically, your question. Typically, if you are thinking of using GIS as a tool for historical inquiry you have a topic in mind, and maybe, hopefully, you’ve already conducted extensive research into the primary sources. You want the project to be driven by inquiry and not by technology. As Ian Gregory and Paul Ell wrote in their book, Historical GIS, “the researcher using GIS should be asking ‘what are the geographical aspects of my research questions?’ rather than ‘what can I do with my dataset using this software?’”1 So you have to consider your question. Yeah, maps are cool and can look impressive, but what is it you want the map to show? What historical questions can geographical representation of historical data can your mapping project demonstrate? If you’re unable to answer the question “what are the geographic aspects of my research question?” you probably need to step back and spend some quality time with your sources and think seriously about the significance of geography to your own inquiry.
The Mapping Violence in Early Modern Italy project has clear geographical aspects in its inquiry. By mapping the spatial and geographic factors related to specific acts of violent crime, historians can analyze the geographic and social significance of violence and investigate how the relationship between specific locations and violence changed over time. These are just a few beginning inquiries. One of the ultimate goals is to provide an open source resource that includes data, documentation, research and teaching materials for people to use without them having to be intimately familiar with GIS programs. It is an ambitious project.
This gets us to the sources. Your research question may have geographic aspects, but can your sources actually help answer that question? The sources for Mapping Violence in Early Modern Italy are extensive and detailed, and they provide significant amounts of geographic information to make it possible to map incidents of violence, even when they occurred over 500 years ago. Although many named locations no longer exist, there is sufficient information to be able to provide a geographical representation of violence in Early Modern Italy.
Working with these sources gave me a greater understanding and confidence for assessing sources for a project I have in mind. I am interested in exploring how the flora and fauna of the upstate NY and eastern Great Lakes region has changed from early colonial contact through the creation of the Erie Canal. So Rome, NY isn’t quite Rome, Italy, but it’s what I’ve got. I would like to be able to show these changes on a map or series of maps instead of merely describing the changes in text. I would like to utilize several sources, including the Jesuit Relations (those Jesuits wrote a LOT) to show the types and locations of flora and fauna in the 17th century. There is ample amounts of evidence in the Relations; Jesuits wrote extensively about what they saw on their journeys, but will they really help answer the geographic aspects of my question? Can this data be mapped? Even after 500 years, many landmarks in Italian cities remain, which allows for the ability to pinpoint where some acts of violence happened. The same cannot be said for the landscape of the eastern Great Lakes/upstate New York, which has changed quite dramatically since the 17th century.
There are plenty of problems with the Jesuit Relations as a source as most historians who have used them tend to focus on information concerning Indigenous peoples. Needless to say, those descriptions of Indigenous ways of life and Jesuit “success” in converting Indigenous peoples are quite problematic. But what about their descriptions of the natural world? How reliable and accurate are those? Did they actually know the types of plants, trees, fish, birds they were describing? When they give a geographical location, is it possible to know where that location is on a map? I really have to answer this before moving further with the project.
The following is an excerpt from the Jesuit Relations, Volume 41. In it Fr. Le Moyne is describing his journey from Onondaga territory back to Montreal in 1654. Some of the information I would like to map is highlighted in blue. But is it possible to do so accurately?
“The 16th. We arrive at the entrance to a little lake in a great basin that is half dried up, and taste the water from a spring of which these people dare not drink, as they say there is an evil spirit in it that renders it foul. Upon tasting of it, I find it to be a spring of salt water; and indeed we made some salt from it, as natural as that which comes from the sea, and are carrying a sample of it to Quebec. This lake is very rich in salmon-trout and other fish.
“The 22nd. Coasting quietly along the shores of this great lake, my boatmen shoot at and kill a large Stag. My companion and I content ourselves with looking at them while they broil their steaks, it being Saturday, a day of abstinence for us.
“The 23rd. We arrive at the spot which is to become our dwelling-place and the site of a French settlement. There are beautiful prairies here and good fishing; it is a resort for all Nations. I find some new Christians who confess and inspire me with devotion by their sentiments of Piety.
September the first. I never saw so many deer; but we had no desire to hunt them, though my companion killed three almost in spite of himself. What a pity! for we left all the venison there, except some of the more delicate portions, and the skins.
“On the second of the month, while proceeding across vast prairies, we see in different places large herds of wild cattle; their horns resemble in many respects the antlers of a stag.
“The 3rd and 4th. Our success in the chase does not abate, game and venison appearing to follow us everywhere. Herds of twenty cows leap into the water, almost as if to come and meet us, and our men, for sheer sport, kill some of them with their hatchets.
Okay, so you have your sources, and you know this can be turned into quality mappable data. So it’s time to move on to the exciting part–data entry! Yes, a LARGE part of creating GIS maps for history is the creation of spreadsheets. The fabulous data in Italian court records, Jesuit Relations, censuses, etc has to be put into a form that is readable for your GIS software, and the first step for this is to create a spreadsheet. You need to put as much thought and planning into this as you did in deciding if the information is mappable in the first place. Yes, populating the spreadsheet is basic data entry, but what exactly are your categories? What level of detail do you want or need? Even if you are super familiar with your sources and come up with your categories, you will probably need more than you originally thought. Go into as much detail as possible; it is always easier to take away than to go back and add information. This became apparent to me when creating spreadsheets for the Mapping Violence project. The sources are in Italian; I do not read Italian. Usually it was easy enough to decipher the information Dr. Madden wanted: place names, family names, places, weapons, but every once in a while there was a level of complexity or just so many names and places I was able to decipher, but I wasn’t able to make clear sense of, and I did not want to keep bothering Dr. Madden for translations. My solution: include all the information I could, and if Dr. Madden does not need it in the end, then it will be easier to take it out than to try to populate the entry after the fact. Just like with that odd bit of information you come across and think to yourself, “do I really need this?” The answer always is to record it just in case.
One category for your data spreadsheet that is an absolute must is location, otherwise you have no map. This moves us closer to our technology needs. You will need to geolocate, which is acquiring the latitude and longitude coordinates, the location of whatever information you are trying to map. This is where you want the most accurate information you can get. For sites you can find on a Google Map, such as the Duomo di Modena in Modena, Italy, you just have to place your computer cursor on the Duomo and “right click.” That will give you the latitude and longitude, which you can then copy and paste into your spreadsheet. Boom! The Google map below shows the latitude and longitude of the Duomo di Modena highlighted in yellow.
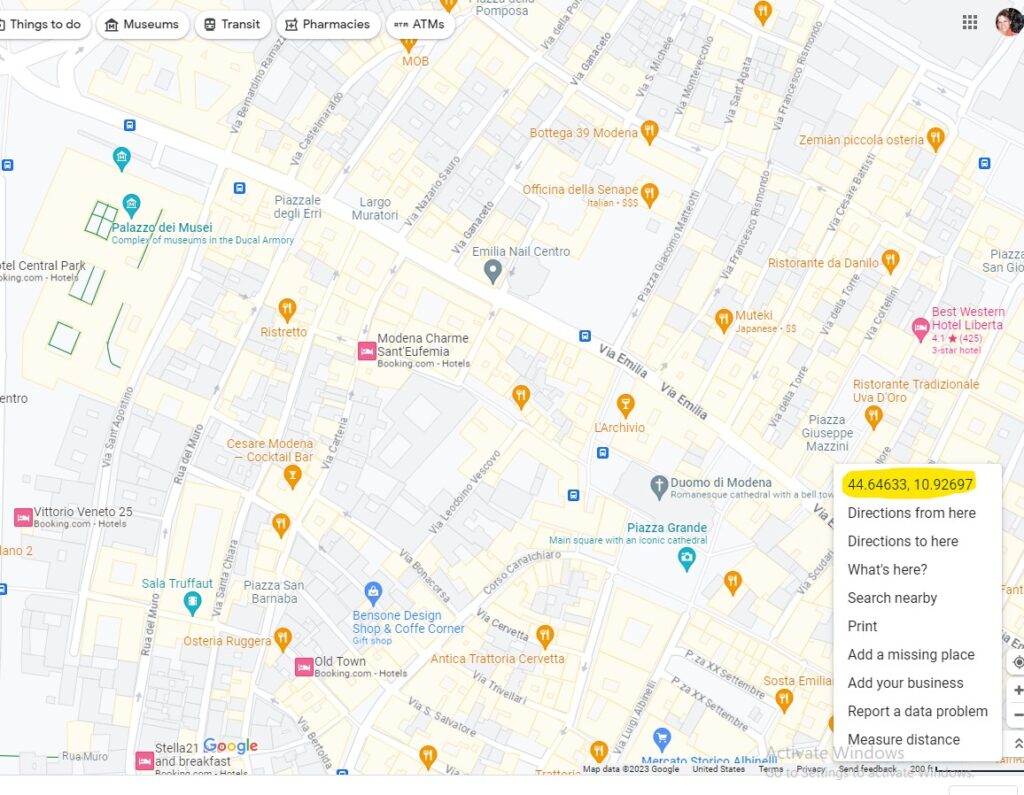
For particular acts of violence in early modern Modena, the sources would indicate such a specific location. Other locations might be less specific, such as a small village or a road with no indication of where on that road the act of violence occurred. That is where you must make decisions based on what your goals are and how specific or general you can be in determining location.
Clearly, even before you get to the GIS, there is a significant amount of work that needs to go into any mapping project. But now you have some mappable data, and it’s time to get to the technology. I came into this project knowing next to nothing about GIS, and I am not confident in my skills with technology (yes, so I opted, as a mid-career history professor, to get training in Digital Public Humanities. Talk about moving out of my comfort zone.) One of the biggest and most important things I learned early on this program is that Digital Public Humanities requires a great deal of collaboration. The Mapping Violence project is quite ambitious, and there are specialists on the team setting up the digital platform required to fulfill the goals of the project. It is NOT a project that one person can do on her own. That was both a relief to me and a cause of concern; I’ll explain that in just a bit.
Even if you do not need to be a technology expert, you do want basic familiarity with GIS in order to figure out what you want/need and, at the very least, be able to communicate that to those who are dealing with the technology. So you do need a grasp of the basics to at least get started. Then, as is often the case, you eventually have to jump in and learn the old fashioned way, by trying it out, making mistakes, getting annoyed, and, hopefully, eventually experiencing the excitement of actually seeing all your work represented on an actual map. Below is the first map I created in a QGIS sandbox. Yes, I sent screenshots of it to friends and families, and now you will look at it too. It was a very exciting moment.
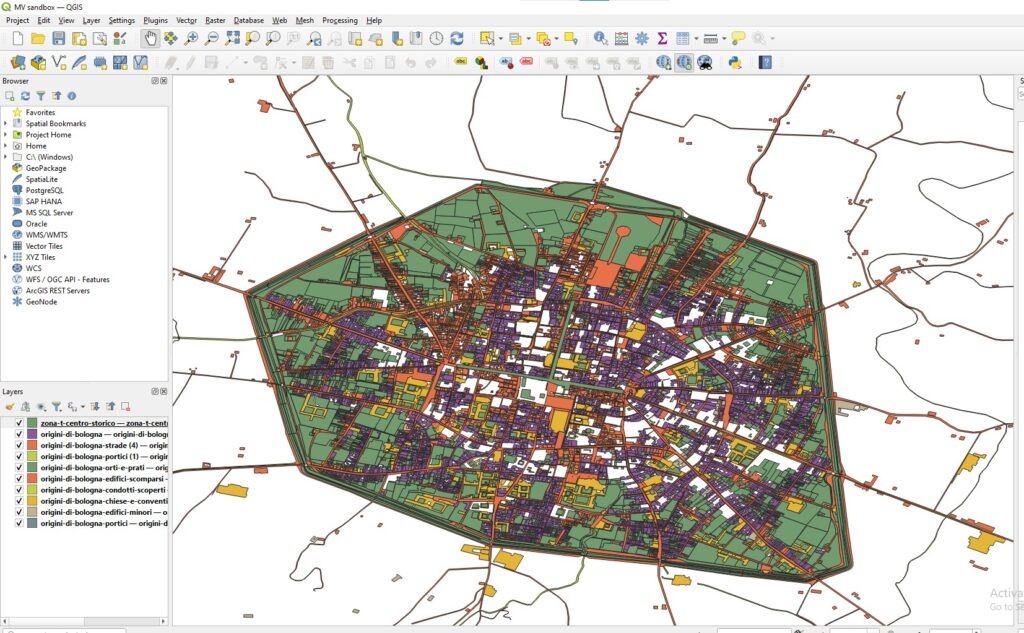
Now here are my thoughts/ideas/suggestions on the actual GIS work and map making process. As I mentioned above, I was both relieved and concerned to learn that historical GIS work is not really an individual project. The idea of someone helping me is wonderful, the concern came in who exactly can do that for me. Another thing to consider is what resources are available to you to complete such a project. The Roy Rosenzweig Center for History and New Media specializes in digital work and has people dedicated to technological aspects of digital history and map making. I have been extremely lucky to be a part of this program in the certificate program. But what about when I finish, and I find myself limited by the resources of my small, liberal arts college that does not have the same resources? I have spoken with colleagues and administrators about how to continue with my digital mapping, but I will not be able to take on something as ambitious as the Mapping Violence project. That does not mean I can not participate in historical mapping; like with all aspects of a project, I will need to make decisions on feasibility. What kind of team can I put together? What software is available to me? How much will this cost? Where will funds come from? Small steps.
So for those who may not have the funds or institutional access for such programs as ArcGIS, there are alternatives. ArcGIS story maps has a free version, although it does not come with all the bells and whistles of the subscription. It can be a good place to at least start working with planning and creating historical narratives with a geographic element. Another free resource is QGIS, which is an open source, downloadable platform. This will allow you to create maps using all that fabulous data you have collected and organized. It also provides you with a lot of basic tutorials on using the platform. It is not compatible with Chromebooks, just FYI.
Okay, you have your spreadsheet; you downloaded QGIS. Now what? You still need to convert your data into a shapefile. This is what makes the data readable for the software. What is a shapefile? ArcGIS explained, “A shapefile is a simple, nontopological format for storing the geometric location and attribute information of geographic features.” I did not find this helpful. Sometimes, the language can be an obstacle to participating in historical mapping. There is help out there, and for anyone starting in GIS, I would recommend the book, which I quoted earlier, Historical GIS: Technologies, Methodologies and Scholarship by Ian N. Gregory and Paul S. Ell, and published by Cambridge University Press. Yes, Dr. Madden recommended it to me, and I have found it extraordinarily helpful in explaining much of the technological aspects of GIS, which I also find the most intimidating aspect of GIS. From them I learned that the shapefile (.shp) provides the geographic information for the categories you have created in your spreadsheet. This allows you to actually map the information. Is there information in there I still do not understand? Yes. But I am now at least at the point where I can ask good questions and search out information I need.
Kepler is another open-source geospatial tool for analyzing data, but it works somewhat differently from GIS applications. I began my foray into mapping historical data with Kepler and came up with these less than impressive map of flora and fauna data from several travel narratives. You have to start somewhere.
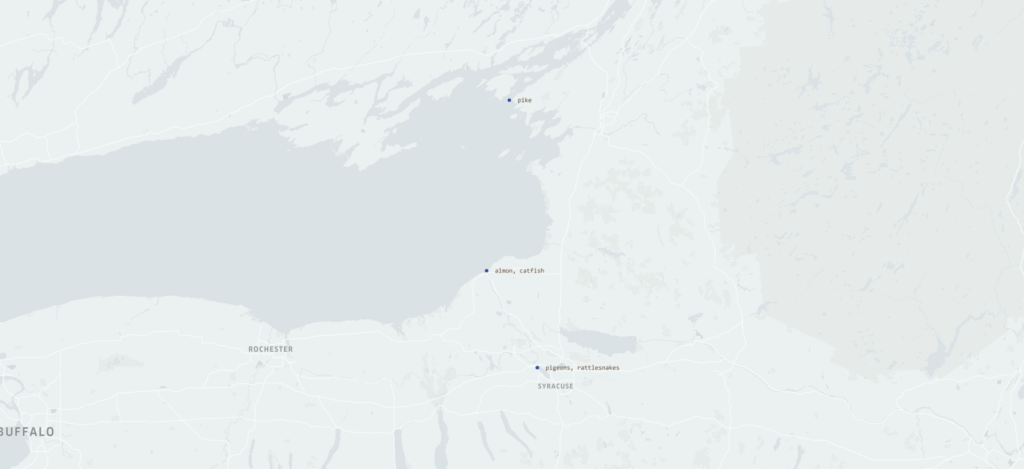
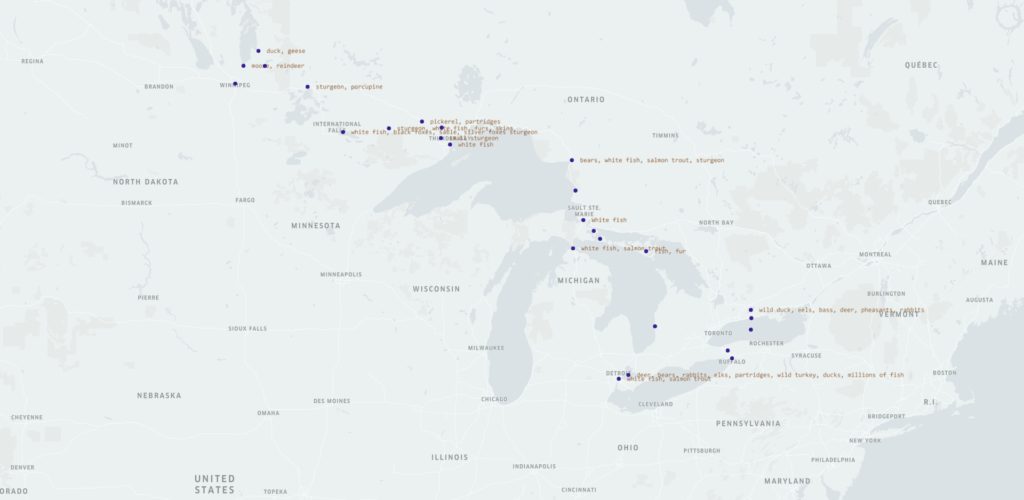
Kelper does have the ability, however, to relate information in various formats including heat mapping and point data (as shown above) as well as relationships among the data via arc and line depictions. It does not utilize shapefiles or layers as GIS programs do.
Where to go from here? When I no longer have access to the resources available through George Mason, along with Gregory and Ell, a big part of my team will be, yes, Google and YouTube! Through Google searches and YouTube videos I have learned how to cut crown molding, fix my KitchenAid mixer, and play the drum part for U2’s Bullet the Blue Sky. I also learned how to take the Excel spreadsheet with all the organized data and turn it into a shapefile to create “layers” for the GIS maps. Gregory and Ells explained to me what a shapefile is and what it does, but they did not explain how to actually get from the spreadsheet to the .shp. The videos have been extremely helpful and allow you to take in small bits of information and then try that information out for yourself.
One of my favorites is GeoDelta Labs YouTube tutorial “An absolute beginners guide to QGIS.” I utilized two computers and watched the video on one and practiced on another, so I could easily pause, rewind, and replay. I also have used Terra Spatial for more specific questions, such as how one turns their spreadsheet into a usable .shp file. These videos are shorter and focus on one element of QGIS, whereas the GeoDelta video is a more comprehensive introduction. I actually found the GeoDelta Labs and Terra Spatial videos more helpful than the tutorials provided by QGIS. I have used these two sources, but there are plenty out there to try.
And of course, there is plenty of written material out there to use. I already mentioned the Gregory and Ell book, which, as mentioned, Dr. Madden recommended. It is very helpful in understanding the bigger picture of historical GIS methods beyond the purely hands on technical aspects. Dr. Madden also recommended some of the following readings, and I have added others I have found to be helpful. I have not spent as much time with them as I have with Gregory and Ell, but they are also quite helpful in gaining a broader insight into the world of historical GIS from what kinds of questions can be answered with historical GIS.
Bajav, Doing Spatial History. Routledge 2021.
Bonnell, Jennifer and Marcel Fortin, eds. Historical GIS Research in Canada. Calgary, AB: University of Calgary Press, 2013.
Gregory, Ian, Donald Arthur DeBats, and Donald Lafreniere, eds. The Routledge companion to spatial history. Vol. 1. London: Routledge, 2018.
Gregory, Ian N. and Paul S. Ell. Historical GIS: Technologies, Methodologies and Scholarship. Cambridge: Cambridge UP, 2007.
Gregory, Ian N. and Alistair Geddes, eds. Toward Spatial Humanities: Historical GIS and Spatial History. Bloomington: Indiana UP, 2014.
Nevola, Fabrizio, David Rosenthal, and Nicholas Terpstra. Hidden Cities: Urban Space, Geolocated Apps and Public History in Early Modern Europe. Taylor & Francis, 2022.
Scholz, Luca. “Deceptive contiguity: The polygon in spatial history.” Cartographica: The International Journal for Geographic Information and Geovisualization 54, no. 3 (2019): 206-216.
Terpstra, Nicholas, and Colin Rose, eds. Mapping Space, Sense, and Movement in Florence: Historical GIS and the early modern city. Routledge, 2016.
Zaneri, Taylor, and Guy Geltner. “The dynamics of healthscaping: mapping communal hygiene in Bologna, 1287–1383.” Urban History 49, no. 1 (2022): 2-27.
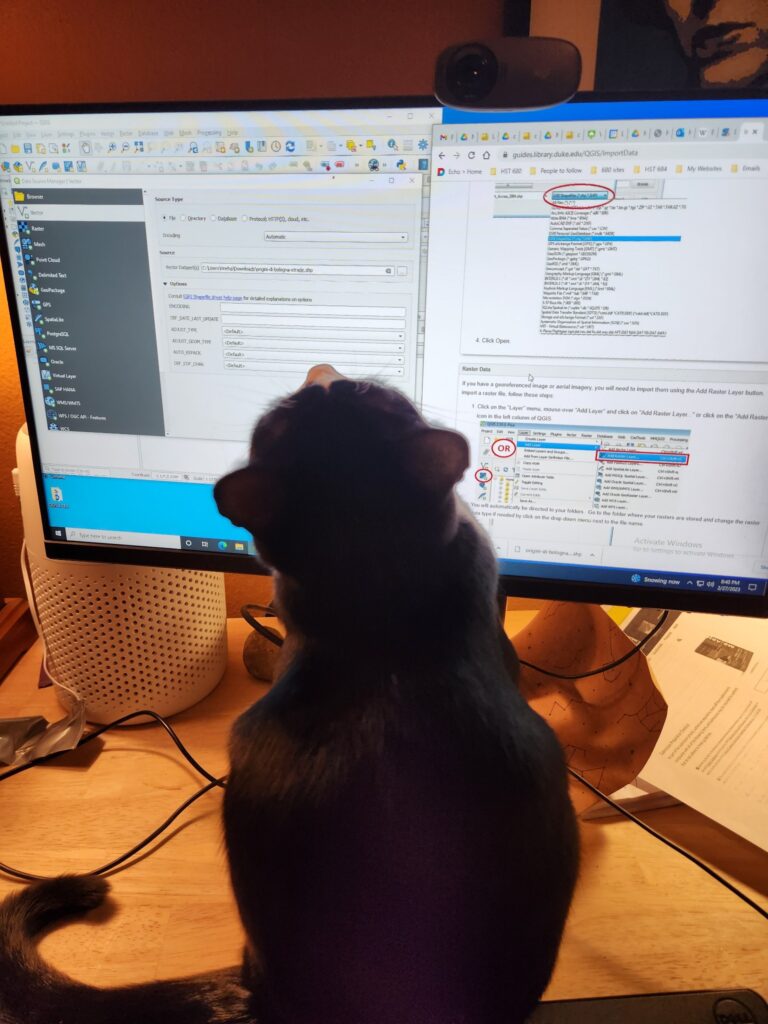
I still have a long way to go to be able to use GIS effectively, but I continue to progress up the fairly steep learning curve. I know enough to work on planning a mapping project and, hopefully, finding people on my campus and funding outside of my institution. I also know enough to ask good questions about the process and the technology and where to find those answers. Finally, let me introduce you to the first member of my team. She’s not a great typist, but she’s very enthusiastic.
Good luck and happy mapping!
1Gregory, Ian N. and Paul S. Ell, Historical GIS: Technologies, Methodologies and Scholarship (Cambridge: Cambridge UP, 2007), 1.