Voyant, kepler, and palladio

For the past few weeks I had the opportunity to explore the WPA slave narratives with the use of Voyant, Kepler, and Palladio digital tools. Each tool provided new insights on using the slave narrative data set, and as I continue to consider the experiences, I see how the threw different tools can compliment each other in helping a researcher come up with research questions and strategies.

For American historians, the WPA slave narratives, and their many problems, are well known. Dealing with issues of age of subjects, loss of memory, lack of trust for the interviewer, no consistent questions or transcription methods, and lack of consistent collection policies have all made the slave narratives a problematic source. Despite these problems, historians continue to go back to them as they are the rare example of the voice, even through layers of administrative changes, of large numbers of people who experienced slavery. The tools under discussion here allow us to view the sources from a distance and look at them in a new light.

Voyant is a tool that allows for textual analysis, particularly text mining. By inputting the documents into Voyant helped to uncover topics of discussion across interviewers and states. The creation of Cirrus word clouds highlighted the words that appeared most often in the interviews and allowed a “big picture” view of the data set that would not be possible reading through the documents. Not only did Voyant help to identify the main words/topics, by looking at a state by state analysis of particular words, one could find outlier words; words that were only used in a few states. This particularly happened when some interviewers wrote the answers in dialect while others used standard spelling. So “master” showed up as “massa” and “marster” as well as “master.” While this reveals methodological problems in the interviews, it does help in creating a strategy in identifying topics across the dataset.

The tools provided in Palladio provided a bit more ability to look at words and topic within the dataset, but with the extra bonus of being able to identify the formerly enslaved person who spoke about these topics as well as the interviewer. By being able to pinpoint this relationship, a researcher can look for other patterns such as do particular interviewers seem to focus on specific topics? Are certain topics discussed primarily with those who served as house or field slaves? Men or women? Palladio’s networking capabilities revealed much about relationships between interviewer and subject.

Palladio is a “mapping” tool, but it is one that focuses on network analysis more so than geographic mapping. So while it was quite helpful in understanding some relationships, when trying to find actual geographic relationships in the data, such as where the subjects were born v. where they were interviewed,” kepler was much more revealing than Palladio. Kepler allowed us to take a big picture view of how people moved, or not, across the country between emancipation and the Great Depression.

Each tool was quite revealing, and I believe putting them together to ask questions regarding the source is even more useful. Researchers could ask more questions regarding geography, such as do we see patterns in subjects who were born in a particular region but were interviewed elsewhere. This could be particularly interesting for those subjects who were interviewed in antebellum “free soil” states. I wondered more about gendered relations between interviewer and subject. Can we see particular topics being discussed when women interview women and men interview men? What about when men interview women? Can this reveal patterns of subjects telling the interviewers what they want to hear? Does geography play a part in this?

While these tools are quite revealing on their own, it is also important to keep in mind that they are tools, not the end product of research. They do not replace the hard work of archival work and reading the actual documents, but they help in formulating questions and further research strategies, and to shine new light on otherwise well known documents.
Working with palladio

Palladio is a network visualization tool created at Stanford University. It allows users to to see connections in large data sets that would otherwise be difficult to discern by just reading the data the old fashioned way.

In using Palladio to create a network analysis of the WPA slave narratives from Alabama, it allowed me to define the information to be analyzed. For example, one could choose as a “source” the name of the interviewer and the “target” the name of the interviewee. The resulting graph shows the networks of interviewers and interviewees.

However, the networks are not equally revealing or useful, at least in my initial explorations of the tool. Showing the relationships between interview location and location of where the subjects were enslaved was less revealing than using the kepler mapping tool. Of course, Palladio is a network analysis tool and not a geographic mapping tool. The information provided included GPS locations and names of towns or counties. It was difficult to get any sort of spatial visualization based off this particular graph. Other relationships were too “busy” to make sense of, at least at my first attempt. So many lines were crossing between topics of interviews and names of subjects that one couldn’t really follow. Maybe with more practice, the networks will be more revealing to me. The creators were also well aware and quite upfront with the limitations of the tool.

As the creators of Palladio said, this tool is not an end in itself. It is yet another tool to help scholars take a wide view look at data in order to help develop further research questions and topics of study that may not otherwise reveal themselves. In comparing visualizations of the relationships between different sources and targets, I was able to form not just initial impressions of the interviews, but also questions which would require a deep reading of the documents again. I am particularly interested in how the interviewers found and chose their subjects. House slaves seemed to dominate the subjects, but one would think that field slaves were more numerous. So how do house slaves become such a large population of subjects? Was it based on how the interviewers found their subjects? Was it based on the willingness of subjects to be interviewed? Likewise, I saw that several female interviewers interviewed only female subjects. Was this by choice of the interviewer? Based on what? Or was it by choice of the subject? Also based on what? Or is there no real connection there at all?

Network analysis through Palladio is a powerful tool to revisit what we think we already know and see if currently accepted relationships hold up. It also can help reveal patterns and relationships we never even thought about.

Mapping with kepler.gl

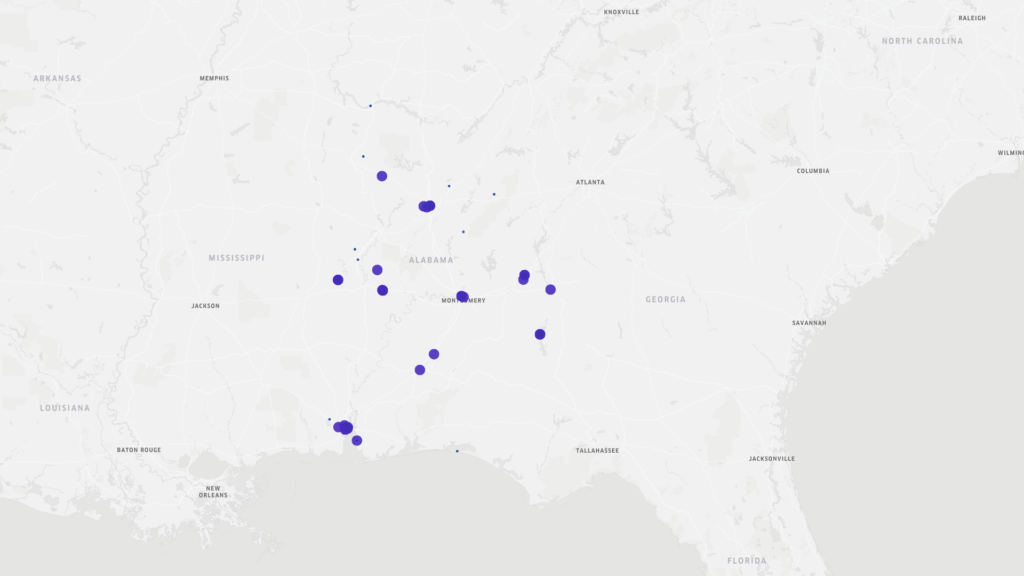
Learning about mapping data was a most enlightening experience, and one I was looking forward to the most. I do love a good map. I was therefore surprised by the fact that my initial conclusions, based solely on a point map were, well, wrong, as was soon revealed by other maps. The original point map showing the locations and basic data regarding the New Deal era slave narratives from Alabama led me to conclusions that the major metropolitan areas of Alabama (Montgomery, Birmingham, and Mobile) were where the most interviews took place.

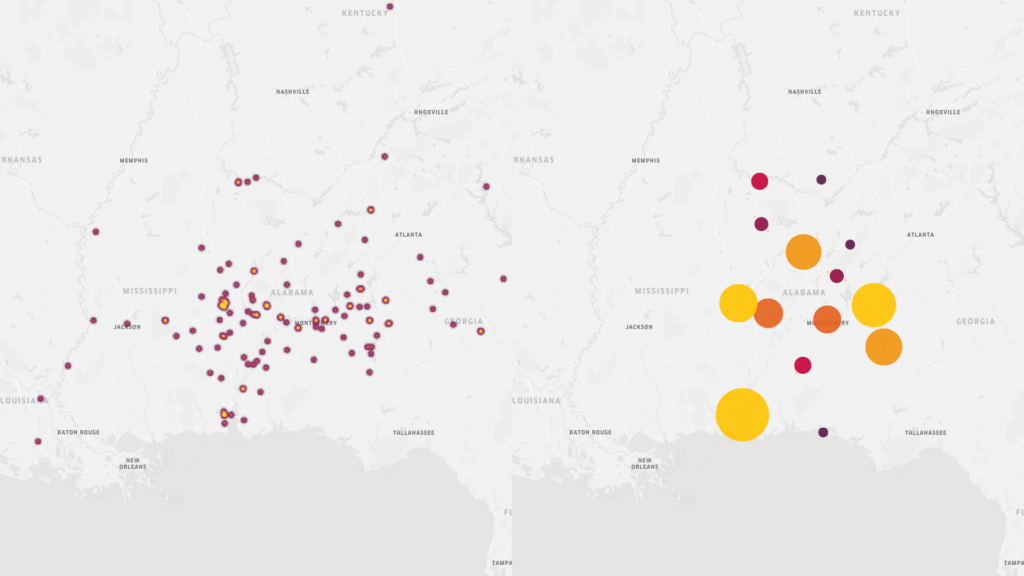
This was true to an extent. However, when moving to maps that show concentrations of interviews in other manners (heat and cluster maps) Mobile still stands out as a key area of concentration, however, we also see other areas outside of Birmingham and especially Montgomery that show greater interview activity.

Kepler maps
Heat and cluster maps of WPA slave narrative interviews in Alabama

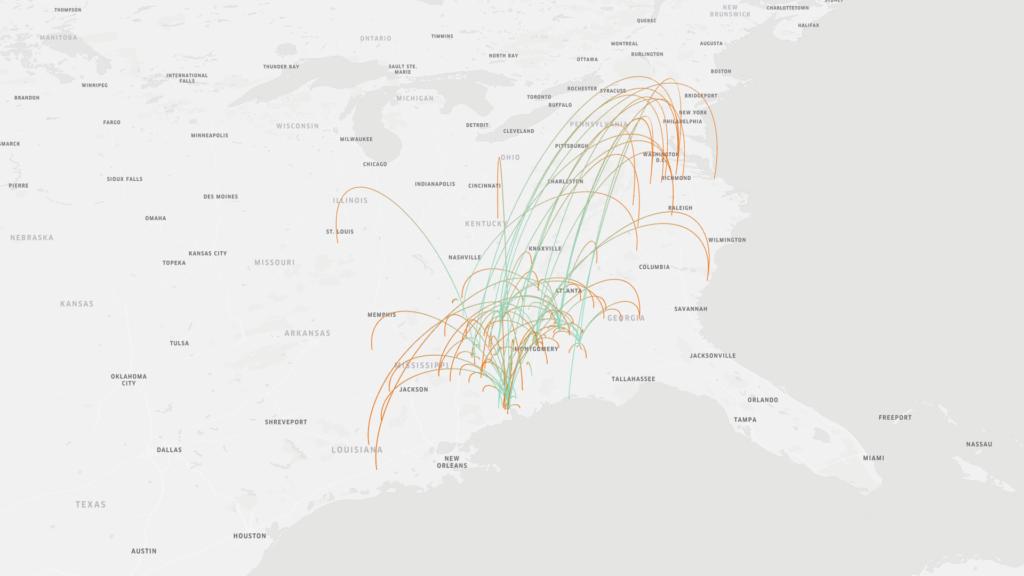
The original map above also provided information regarding the place of birth of the interviewees. Just a brief visual scan of this information led me to believe that most of the interviewees were born near where they were interviewed. However, an arc map that showed the place of birth v. the place of interview gave a different picture. There was much greater mobility of formerly enslaved people than first believed. Trying to read the information on the original map was difficult as the points overlapped. Furthermore, reading the information still wouldn’t give as clear of a story as the map does.

Map indicating place of birth of interviewees (as shown by the green end of the arc) v the location in which the interview took place (as shown by the orange end of the arc)

The Kepler mapping tool is helpful in making sense of spatial data in a “big data” collection such as the New Deal slave narratives. However, it is a learning curve. Understanding how to input parameters was relatively easy when given explicit instructions (thank you), but when I went back and tried to recreate the maps and create new ones, I was a bit confused. Like with so much it will take time. However, reading these various maps brought up questions that I would not have considered if I was just reading the text of the interviews, particularly about movements of people after emancipation.

Biggest lesson learned: never finish with first readings. Rearrange the material. Ask other questions, See how the results differ.

Reflection on using voyant

I used Voyant to learn basic text analysis utilizing the corpus of WPA slave narrative documents. I used the five default tools: cirrus, reader, trend, summary, and contexts. While at times I had problems getting certain elements to work (particularly having the “trends” tool display document level trends of words) the exercise was quite revealing on several levels.

First, it is clear how such a tool can be beneficial in exploring larger trends within a large corpus of information. To see the relationships between commonly used words would be almost impossible by reading through the many volumes and thousands of pages of documents. Once common words were edited out, I saw a pattern in topics revolving around people and relationships, both relationships between members of enslaved families and between enslaved peoples and whites. See my post on the Cirrus cloud.

Second, it is clear that consistency matters. Interviewers did not use consistent terms in transcribing their interviews. Many wrote in a dialect so “master” became “massa” or “marster.” Through the summary and trends tool one can see in which states such dialect transcriptions were used. With each interviewer using their own spellings, it makes it difficult to see the bigger trends within the corpus.

Even with the challenges, use of Voyant with these texts gives a pretty good idea of overall topics when you pay close attention to the various terms. It also provides a way to direct future research into the WPA sources and other sources that may exist. It will take me some time to get proficient with the Voyant tools, but my limited experience has shown me it would be worth it.

reflection on the importance of metadata

Prior to taking this introductory class in Digital Public Humanities, I will admit that I never gave metadata much thought beyond reading what was included in online sources without really questioning. I got the information, and I was good to go. Now I am digitizing my kitchen and realizing how important metadata is to providing sufficient information in a way that gives the reader as accurate a depiction of the image or source as possible.

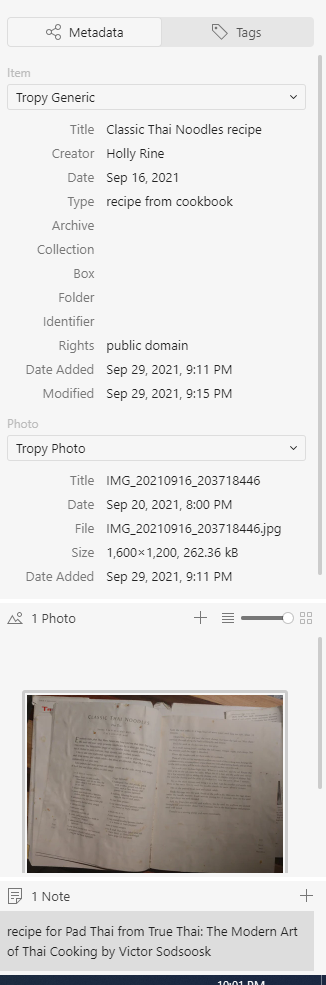
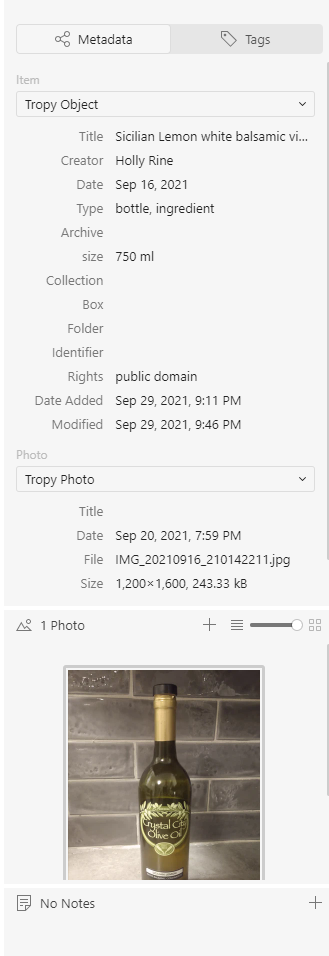
The Tropy generic metadata template works much better for documents than for images. Of course, most people would be using Tropy for organization of documents. With this information, it is much easier to organize material by topics as well as keeping bibliographic information handy. I have learned the hard way, after a few painful lessons, the importance of keeping track of bibliographic information so as to not waste time in a search later on. This method also allows for consistency.

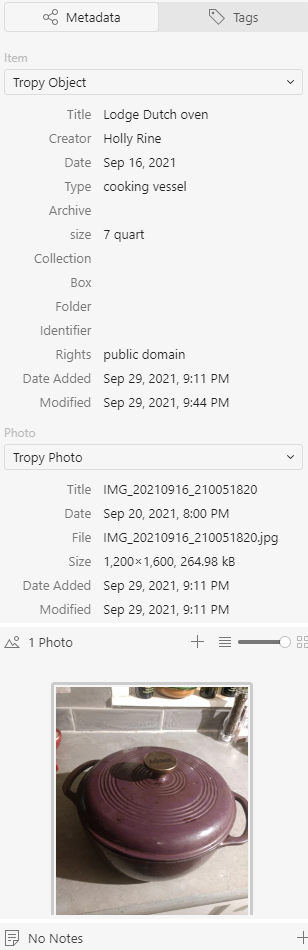
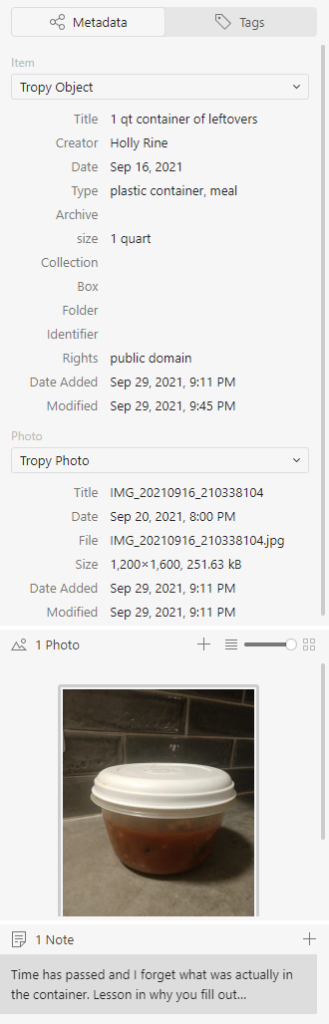
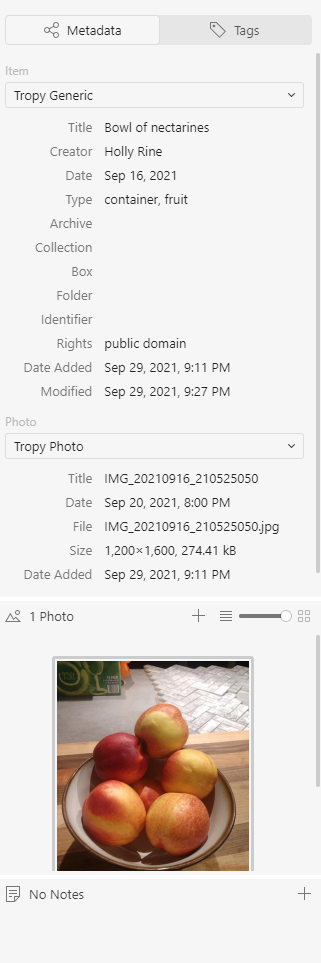
For the objects listed from my kitchen, I thought information such as size and material type (enamel, plastic, glass) would be helpful as well. I customized the generic template for objects that included a size and used it for all five items below. I also wanted to list the actual content of the “leftover” object, but I had taken the photo a couple weeks ago and already had forgotten what was in it. This, of course, served as a lesson for the importance of recording information as soon as possible.

database review of Early Encounters in North America From Alexander Street by Proquest

Holly A. Rine

hrine@gmu.edu

The Early Encounters in North America database is one of about 80 collections offered by Alexander Street: a ProQuest Company. This particular collection focuses on personal accounts of a variety of people who lived and travelled in North America from 1534 to 1850. Sources include both published and unpublished “narratives, diaries, journals, and letters.” Although it appears that the majority of the materials are, in fact, published, with 127 listed and browsable publishers.

Other categories users can browse include titles, people, subjects, historical events, places, and content type. For content type, most of the offerings are books, 327 of them. Despite the highlighting of graphic material such as maps, sketches, and other illustrations, they are harder to come by than text in both browsing and searching functions. Finding graphic material can be so challenging that even when “miscellaneous artwork was selected under “content type” with 23 related works, the first option, “Images of America from the Library of Congress” was a blank page.

The clear strength of the database in its wide variety of text option. But like the lack of images in a source with “Images” in the tile, if one is looking for facsimiles or scans of the originals, he or she will be disappointed. This shortcoming was also noted in a 2002 review of Alexander Street by Suzanne R. Graham, when Alexander Street was all of two years old. Little has changed in that regard in almost two decades and the addition of over 70 collections. All text appears in a uniform font. Three are some sources, such as “A Sketch of Creek Country 1798 and 1799” by Benjamin Hawkins that includes the a facsimile of the original manuscript source along with the transcription. However, there is no information on where the original is held. The citation information lists Alexander Street as publisher in 2003. This source was actually published in 1840, but there was no reason given as to why they chose to use the original, wherever that original may be held.

The advantage of the uniform appearance of the text is that it makes the search for specific words and terms quite efficient. Search options include a simple search box along with much more advanced search capabilities. One can search by words anywhere, full text, author/creator, topic, person, historical event, place, and publisher. If accessible through the particular institution, a researcher can expand the search to include additional Alexander Street databases such as Black Thought and Culture and North American Women’s Letters and Diaries. Searches can also be defined through date of creation or publication as well as place of creation or publication.

Original publication information is given for each document, but as noted above, location of unpublished materials is not included. Methodology of digitization is also not discussed within the database. If someone is looking for information on the original production such as views of binding, print font, or size of volumes, this is not the place to go. Their focus is clearly on offering easily searchable and readable primary source text material across a wide variety of categories. As long as that is where one’s interest ends, the database is extremely useful. They also include citation information for each source in a variety of formats which can be shared directly to several bibliographic programs.

Pricing options are not listed in the Terms and Conditions. From further research, Alexander Street offers pricing to institutions on a case by case basis. Access to the numerous collections Alexander Street offers is limited to those who are associated with a subscribing institution. Contact information is provided.

Alexander Street

7500 Old Georgetown Road
Suite 1400
Bethesda, MD 20814

1 800 521 0600

A link to request information can be found on their “Contact Us” link at https://alexanderstreet-com.mutex.gmu.edu/contact-us

Previous review

Review of the Alexander Street Press Electronic Collections
Suzanne R. Graham, vol. 5, no. 1, May 2002. Ann Arbor, MI: MPublishing, University of Michigan Library May 2002. http://hdl.handle.net/2027/spo.3310410.0005.110

Guide to digitization

Digitizing items requires much more consideration than merely taking a photo and uploading it to your site. How does one capture the essence of the item in a virtual environment? When creating an archive, one must consider how to convey as much information as possible for any item: size, use, material, color, sound, and, yes, smell. Also, one must consider the readability of text images. For non-text images, it seems that video provides greater information than a still image. One can compare sizes of similar items or at least add scale, although that can be done with a still image the scale item can be temporarily added then removed from a video thus keeping the focus on the main item. Videos help to provide sound; one could go so far as to narrate the item, but metal lids do provide a sound that indicates material and a bit of information on weight. One can get a better sense of the image as a whole in video. Are there marks on the bottom of some items indicating where and when something was created? Is the appearance of the item uniform throughout? It is easier to see this on video, although multiple photographs could be utilized as well. The big question regarding use of video would be the size of the file. If uploading many videos, would that be burdensome for the site or for the user.

Digitizing photographs, while seemingly straightforward, just scan photo and upload, also requires much more consideration, especially given the software that is now available to edit and enhance photographs. Do you upload the photo as it is in its current condition? Do you upload the photo after “repairing” wear and tear and other “defects” of time? Does color correction or changing the contrast to make certain elements more visible change the meaning of the photograph? Does it then become a different artifact?

While clearly digitization of historical sources has increased the opportunities for scholarship by making sources in far away places available to researchers who could otherwise not access them, the scholar now has a new set of questions to ask of the sources on his or her screen. Questions not just of scholarly significance but of accuracy of representation and even of the contextualization of the content collections.

Folger Shakespeare Library luna collection

https://www.folger.edu/

https://luna.folger.edu/luna/servlet/FOLGERCM1~6~6

All of the images in the Luna collection at the Folger Shakespeare Library, unless under a non-Folger copyright, are  available under Creative Commons Attribution-ShareAlike 4.0 International License  (CC BY-SA 4.0). Image collections include bas relief, book bindings, book illustrations, first folios, manuscripts, microfilm, and reference. In addition to Shakespeare first folio images, one can browse theater records, medicinal and cookery recipes, and illustrations from An entire body of philosophy, according to the principles of the famous Renate Des Cartes,

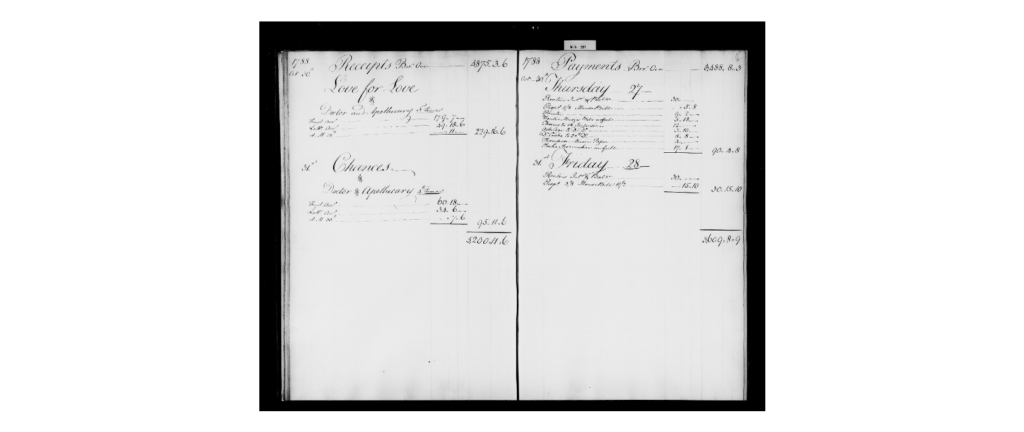
Image from Records of Drury Lane Theatre [manuscript], 1766-1880. Folger Shakespeare Library.

Prelinger archives

https://archive.org/

https://archive.org/about/

The Prelinger Archives’ “mission is to provide Universal Access to All Knowledge.” To accomplish this mission, the archive contains billions of webpages, over 28 millions books, 14 million audio recordings, millions of videos and images, and over half a million software programs. Their focus is on books, and any book in the archive published before 1926 can be downloaded. Modern books can be checked out as with any lending library. The archive works in collaboration with many institution partners including the American Library Association, the Boston Library Consortium, and the Digital Public Library of America, just to name a few. The contents of the archive are really too vast to summarize.

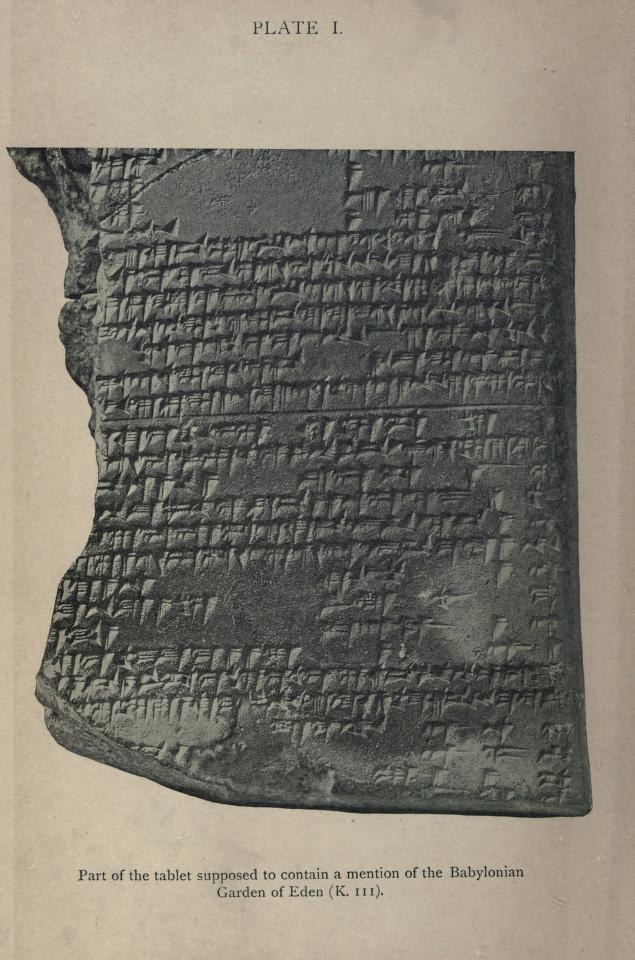
image of The devils and evil spirits of Babylonia : being Babylonian and Assyrian incantations against the demons, ghouls, vampires, hobgoblins, ghosts, and kindred evil spirits, which attack mankind, tr. from the original Cuneiform texts, with transliterations, vocabulary, notes, etc by Reginald Campbell Thompson, 1876-1941.